The market for smart speakers, also commonly referred to as voice-enabled smart speakers and virtual personal assistant (VPA)-enabled wireless speakers, is still a very nascent market. Yes, the market has enjoyed tremendous growth, especially over the last six months, but there is still significant growth yet to be had.
I’m already beginning to see some analysts suggest we are close to peak adoption/sales and that annual sale volume will begin to decline as soon as 2020. I created a very quick household adoption model for smart speakers to illustrate why this is dead wrong.
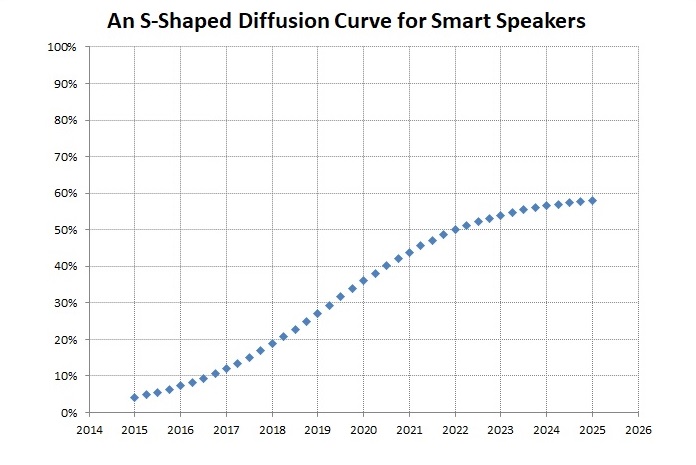
I’ve modeled a simple s-shaped diffusion curve for smart speakers. You can see we are still in the early phase of adoption. My model makes some simple assumptions:
- Smart speakers have a long-term (peak) household adoption rate of 60 percent
- Smart speakers will reach 55 percent of their peak adoption rate by 2020
- Smart speakers will reach 90 percent of their peak adoption rate by 2023
We can change any of these assumptions without fundamentally changing the outcome. The reality of the smart speaker market is probably close to my illustration. My simple model suggests roughly six percent of households owned a smart speaker by the close of 2015 and some 19 percent own one today and those seem to be consistent with what the analyst community is estimating.
Analyst estimates suggesting annual smart speakers sales will peak in 2019 and begin to decline are difficult to defend. My simply illustration/model certainly doesn’t support that premise. Here are some narrative arguments in support of my perspective and the simple model I present:
- Apple’s HomePod hasn’t started to ship yet. Other competitors (i.e. Microsoft) could also enter the market. This will be a lift for 2018-2020 unit volume sales
- Unit volume is inversely related to price. Any increase in competition will drive prices lower and increase unit volume. We’ve already seen that with the introduction of the Amazon Echo Dot and the Google Home Mini.
- Google’s major investment at CES suggests Google is intent on making a strong stand in the smart speaker market. Neither Amazon nor Google seem concerned about margins on hardware sales. They both appear to be after a decidedly larger market and are willing to discount hardware prices in order to propel sales higher.
- Current ownership rates are only at 15-20 percent. Annual sales volume won’t turn negative until ownership rates get closer to peak household adoption levels. My simple illustration here suggests annual unit volume should continue to grow through at least 2021.
- Density rates, the number of smart speakers per household, are still low, but I expect them to rise significantly. TVs are one of the most densely owned consumer technology products. Households own roughly three on average. Given how use-case scenarios are emerging, I could easily see smart speakers eclipsing that. We spend roughly 60 percent of our awake time at home in the kitchen. As households began adopting smart speakers, they naturally placed the first one they bought in the kitchen. From there households are adding smart speakers to secondary and tertiary rooms like bedrooms, offices, and living rooms.
- My simple model suggests a household adoption rate with a positive second derivative until 2020. In other words, adoption is increasing at an increasing rate until 2020. Even in a world where sales are only purchased by new households, in other words, there are no replacement purchases nor households buying more than one unit, unit sales volume should grow through 2020.
- Industry analysts seem to confuse s-shaped diffusion curves with annual unit sales occurring over the same time period. Remember, the s-shaped diffusion curve characterizes household adoption and ownership rates over time. It doesn’t explicitly say anything about sales. Sales are a function of three things: (1) new household adoption, (2) replacement purchases by households who purchased the product in a prior period, and (3) households buying more than one device (density rates expanding beyond one). Only #1 is directly influenced by the shape of the diffusion curve. And remember, my simple illustration shows household adoption increasing at an increasing rate into 2020.
The smart speaker market is nascent and we aren’t close to peak adoption, nor peak sales, anytime soon.